

Analysis of HAKUTO-R Spacecraft Landing on the Moon, 2023-Apr-25
May 19, 2023Iban Cardona, Daniel Estévez, Peter Gülzow Edgar Kaiser, James Miller
©2023 The Authors
Summary — The ispace HAKUTO-R M1 spacecraft mission was planned to land on Earth’s Moon in or near Atlas crater at 2023-04-25 16:40 utc. But the HAKUTO-R M1 signal ceased abruptly at 16:45:09 utc, and it was immediately clear that the spacecraft had not landed as planned. The final 88s of doppler shift profile indicated free fall, followed by a destructive landing on the Moon.
1. Observers
A number of interested radio amateurs watched the spacecraft’s radio signal before and during the event, and pooled their findings. This paper is a summary.
Prior to the landing date, using a 1.0m antenna near Kiel, Edgar DF2MZ http://df2mz.de had followed the doppler shift development throughout April, providing valuable information about the orbit evolution prior to April 25. Summarising, on April 18 he was able to determine the orbital period 7066s and altitude 100km; and on April 21 he found that that the orbit was nominally polar.
On April 25, using a 1.5m antenna near Tarragona, Iban EB3FRN monitored the spacecraft carrier frequency via a Baudline software defined spectrum analyser with high resolution waterfall display. Sample rate 2.5 M sample/s, decimated to 156250 sample/s and 218 point FFTs.
Simultaneously, using the Bochum, Germany 20m antenna remotely, James G3RUH and Peter DB2OS monitored frequency from (a) hardware measurements and (b) two software based spectrum analysers, also with waterfall displays. The latter can be accessed here:
https://www.youtube.com/watch?v=lfg23f9yyMo AirSpy
https://www.youtube.com/watch?v=Uqk3qVlBzaE Aaronia
Signal analyst Daniel EA4GPZ provided live expert commentary.
Over the following days, pooling information and analysis enabled us to re-create the events of the final 25 minutes of the trajectory.
Final source material which individuals contributed is (full report only) contained in folders labelled DB2OS, DF2MZ, EA4GPZ, EB3FRN, and G3RUH is here as ZIP file: Analysis of HAKUTO-R Spacecraft Landing
2. Understanding Frequency Measurements
This summary should be read in conjunction with annotated frequency profile from station EB3FRN. It is a ‘waterfall’ display of the received signal. The signal was also recorded for detailed examination later.
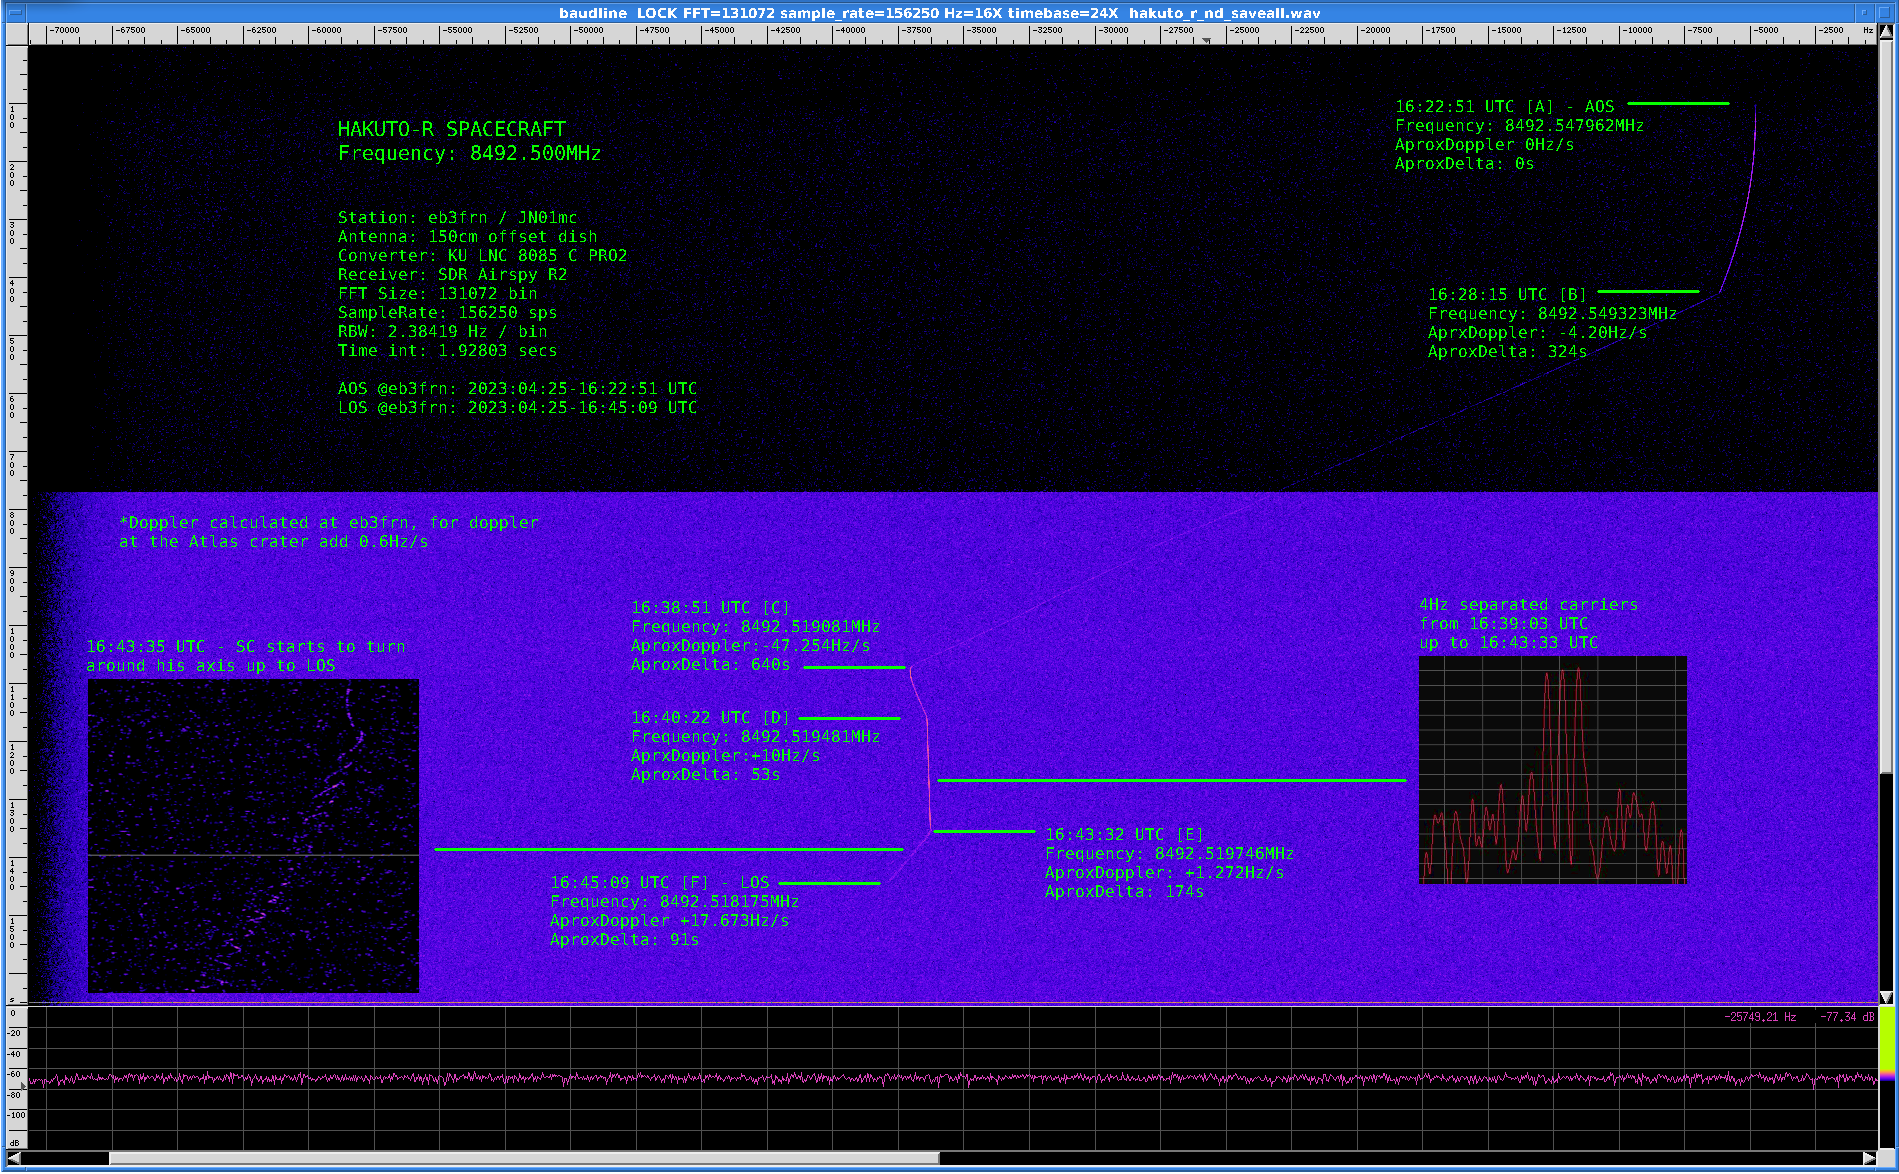
Fig01: Full landing frequency record with annotation
The plot is of spacecraft received frequency (horizontal) vs time (vertical). The frequency is not constant due to doppler shift caused by the spacecraft’s changes of speed relative to the observer.
It is important to remember that 3-D acceleration and velocity observations are as viewed from Earth, onedimensionally, along the Earth-Moon line. Thus an object moving directly along that line will reveal its full speed, whereas if moving perpendicular to that line, the speed will appear to be zero. Ditto acceleration. So care is needed to relate observed changes in frequency shift to the true acceleration and velocity.
The frequency plot (scaled by wavelength) is an analogue of true velocity resolved along the Earth/Moon line-of-sight. If you rotate the plot 90° anti-clockwise, to place the time axis horizontal, you have a more natural presentation.
The slope of a section of a trace is equivalent to acceleration. A kink in the plot of a thrusting object implies an attitude change.
In addition to any motor thrust, the Moon’s surface gravity 1.624 m/s2 is always adding a downward acceleration. The observer sees this value diminished by the sine of the angle of elevation of Earth above the Moon’s horizon. About 0.6 m/s in our scenario. Gravity at 100 km altitude is 1.452 m/s2.
When visualising the trajectory it is helpful to think about things as though you were travelling on the spacecraft, always with an eye on Earth. Early on when in orbit, travelling horizontally looking forward through the motor face, Earth is at an elevation of 26° above the horizon, azimuth 226° (45° to the right). When descending, now looking out the “top window”, Earth looks to be 64° from the vertical.
Finally, the frequency profile looks like a series of straight lines. In reality the transitions take a finite amount of time, and creating an exact timestamp for the each stage’s start and finish is unrealistic. Except for the last one!
3. Reference data
MOON Physical
 GM/1012        4.903  m3/s2
 Radius        1737.4 km
 Gravity       1.624  m/s2

HAKUTO Orbit
 Altitude      100    km
 Period        7066   s
 Speed         1634   m/s
 Angular vel.  3.06   °/min
 TX Wavelength 0.0353 m
4. Frequency Profile Interpretation
fig01.png shows five distinct phases to the frequency profile. The start of each phase is labelled A,B,C,D,E,F and discussed individually.
By detailed analysis EB3FRN has calculated the spacecraft change of frequency over each period. Thus the accelerations are approximately:
    Start        End      Duration     Fdot     Accel
     UTC         UTC         s         Hz/s      m/s2
------------------------------------------------------
A   16:18:09 - 16:28:15   606                         Bochum's AOS time
B   16:28:15 - 16:38:51   640       -46.654    1.6469
C   16:38:51 - 16:40:22    91        10.6     -0.3742
D   16:40:22 - 16:43:41   199         1.995   -0.0704
E   16:43:41 - 16:45:09    88       -18.561    0.6552 Free fall
F   16:45:09                                          LOS
------------------------------------------------------
Frequency profile B-E shows a descent-to-land process.
At ‘A’ the spacecraft emerges (AOS) from behind the Moon, engine facing forward.
At ‘B’ the main engine fires to decelerate from orbital speed 1634 m/s.
At ‘C’ the spacecraft is re-oriented, engine almost downwards
At ‘D’ there is a slight change in attitude and almost zero net acceleration follows. However the spacecraft will still carry downward speed. ‘D-E-F’ should be a controlled descent to ground; a steady drop, braking and touchdown.
At ‘E’, however the profile is that of freefall, and ‘F’ is the consequence.
4.1 Signal
The signal spectrum showed two data sidebands at approx 256 kHz spacing, indicative of a 128 kHz subcarrier. From the width of the sidebands, the symbol rate seemed of order 15 ksym/s.
During the long deceleration period ‘B-C’ the residual carrier signal strength noted at Bochum was very steady, with a carrier to noise ratio (in 1 Hz) of 37.1 dB. That can be referred back to the spacecraft to estimate the transmit residual carrier power to be approximately 150 mW e.i.r.p.
4.2 Powered Descent
4.2.1 Section B-C
The motor starts and the speed reduces. Altitude now decreases due a vertical component of thrust and the orbital speed for the altitude is now too small.
There is a slight decrease in acceleration about 6/10 of the way through this section, probably a mid-course attitude change. Just discernible in the plot.
A signal reflection is visible at the end of the long deceleration burn section ‘B-C’, from 16:37:55 to 16:39:30 utc. For explanation refer to paragraph 4.3.3, ‘Signal Reflection’.
4.2.2 Section C-D
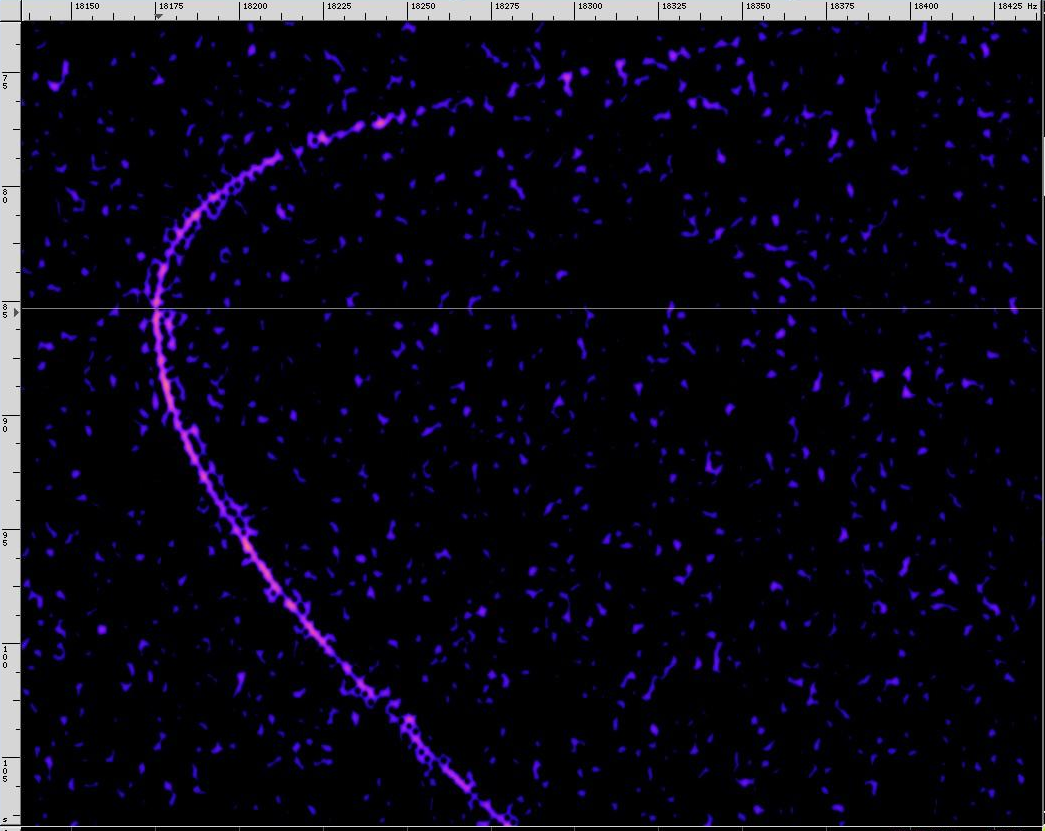
Fig02: Spacecraft pitch down reorientation ‘C’
At ‘C’ the spacecarft reorients by pitching downwards and there is a brief moment of zero acceleration as the net acceleration (thrust plus gravity) is momentarily perpendicular to the observer’s line of sight. ‘C-D’ continues the main deceleration phase.
4.2.3 Section D-E
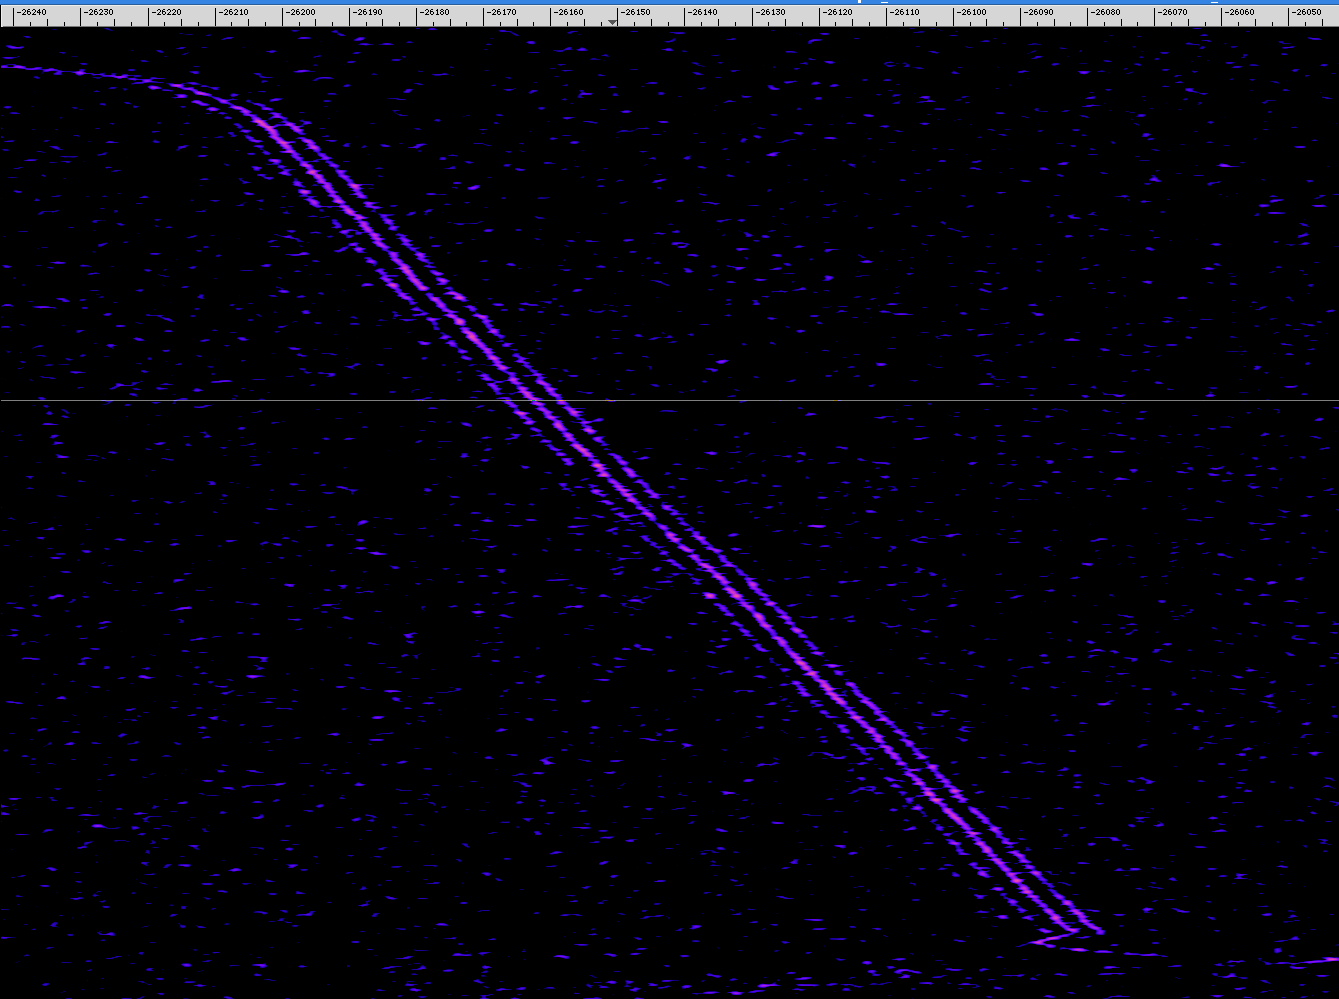
Fig03: 4.3 Hz sideband during section ‘D-E’
When ‘D-E’ is magnified there are two pronounced sidebands at at ±4.3 Hz. Reasons for this may be linked to vibration in the structure caused by the main engine. This vibration may then affect the TX oscillator. But it’s not present during the long burn section ‘B-C’.
Also in section ‘D-E’ the observed acceleration is very small, as though the engine is just balancing gravity. There is no obvious reason for doing this.
The small apparent acceleration is more likely to be that the thrust+gravity vector is almost perpendicular to the spacecraft-Earth line. The pitch angle would be ~60° downwards (90° is vertical downwards).
However the spacecraft is still descending due to prior speed, and is still many km above the Moon’s surface.
This section is over 3 minutes long, and would form part of the fine tuning of the descent. That changes abruptly at ‘E’.
4.3 Unpowered Descent Section E-F
Several interesting things happen in during this 97s period.
Section ‘E-F’ shows a sudden acceleration of 0.655 m/s2 away from the observer. This value is consistent with vertical free-fall as seen along a line-of-sight to Earth 23.8° elevation above the Moon’s horizon.
That elevation implies that the spacecraft would land about 3.3° (99 km) North of Atlas crater centre. (At Atlas, Earth’s elevation would be 26°).
The landing could also have been in Atlas crater but at a pitch angle of -86.7° rather than -90° which is vertical down.
Or somewhere in between.
4.3.1 Spin-up
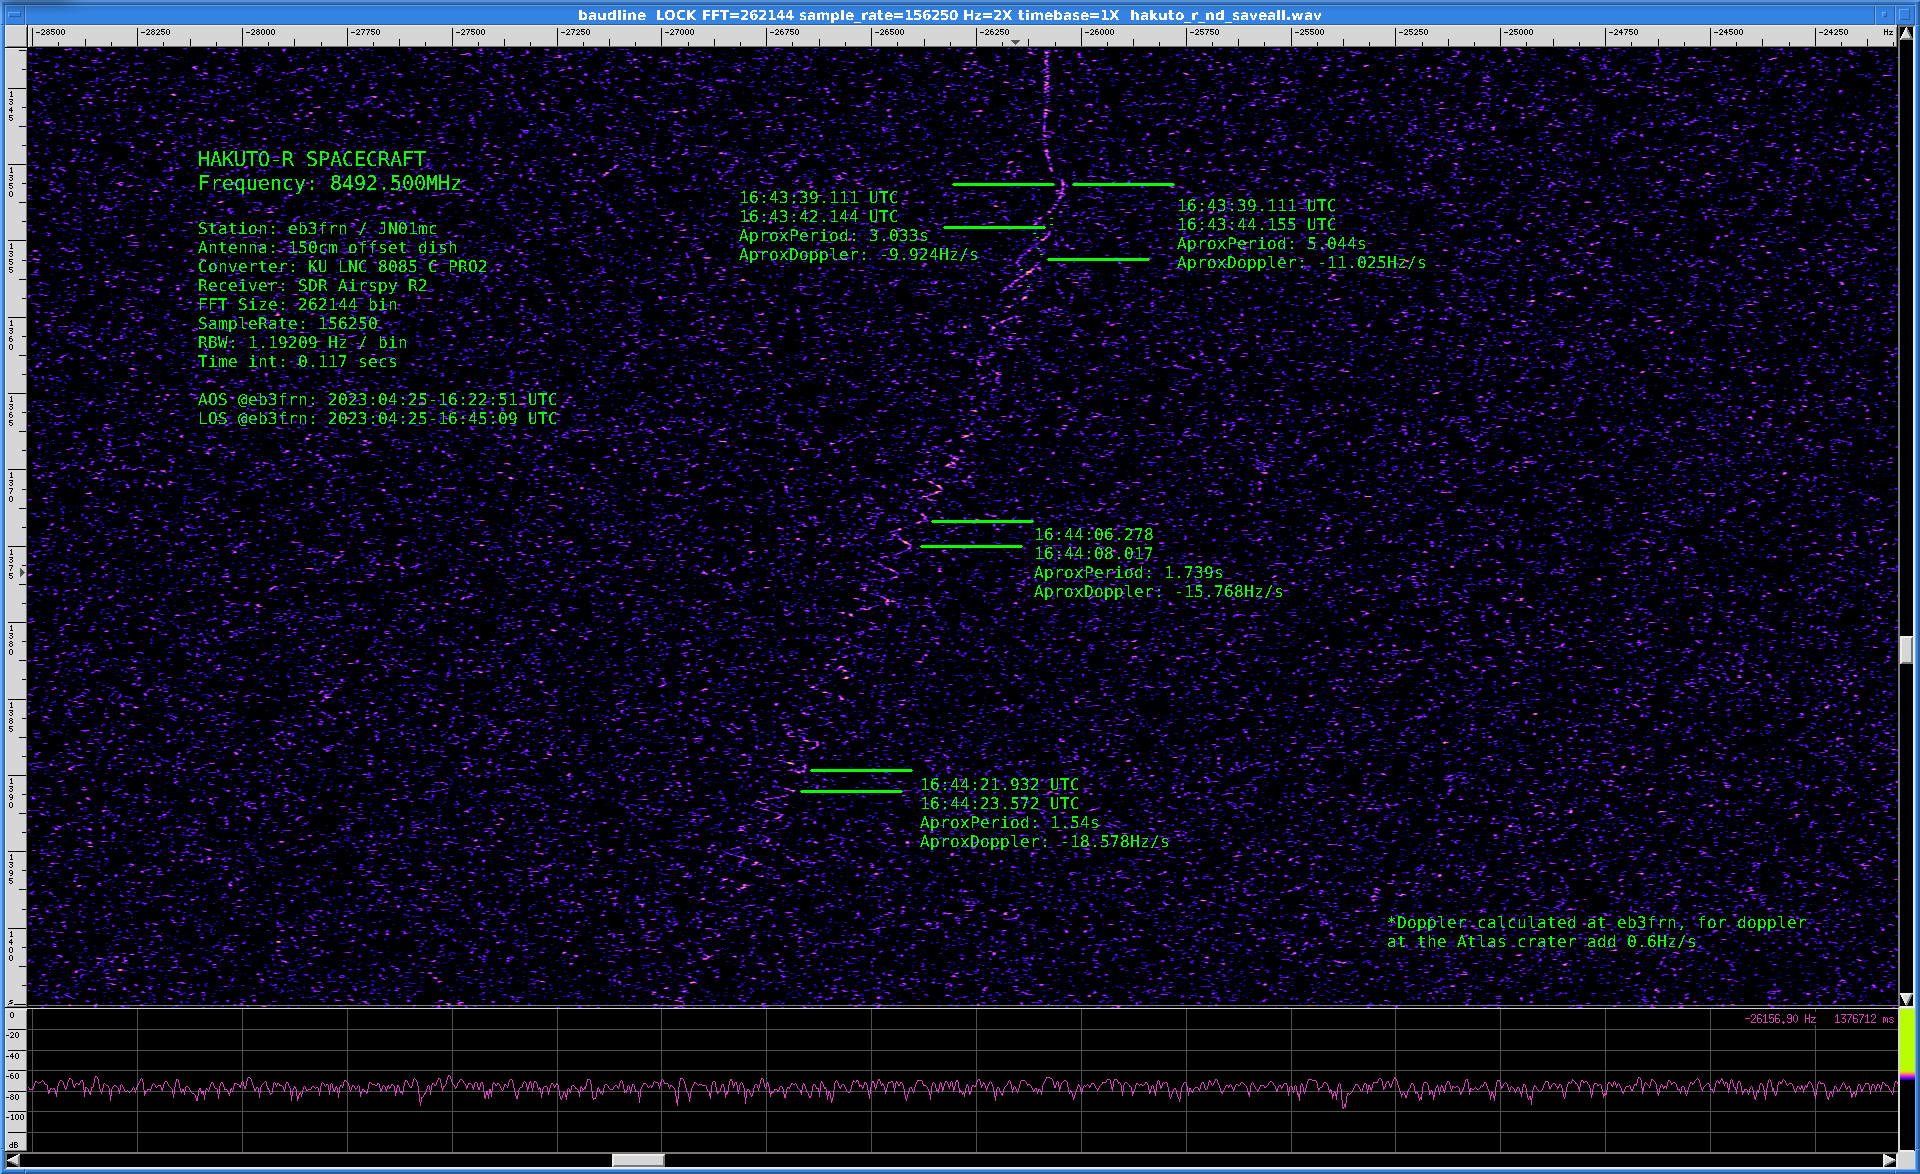
Fig04: Carrier frequency wobbulation during freefall section ‘E-F’
During 6s around ‘E’ the spacecraft is spun up axially to 40 rpm. This is detectable in the frequency trace. It shows a sinusoid with frequency wobble of 78.6 Hz pk-pk. In the AirSpy display, the signal strength can also be seen pumping up and down in amplitude 5 dB with a period of 1.5s (40 rpm). This is due to minor variations in the antenna beam pattern and possibly shading.
The spin-up occurred quickly at ‘E’. This may have been deliberate, or it may have been a consequence of erratic motor/thruster behaviour. Deliberate choice seems the most likely.
4.3.2 Frequency Wobbulation
Frequency wobbulation can be used to estimate the antenna location on the spacraft top face. 78.6 Hz pk-pk and 40 rpm implies the antenna motion, (resolved along the line-of-sight to the observer), was 0.66m pk-pk. Assuming the spacecraft is now vertical in a landing attitude, the true antenna movement as seen from a spacecraft a little north of atlas crater would be 0.72m. That would mean that the antenna located at a radius of 0.36m from the spacecraft spin axis. From publicity drawings this looks to be approximately the case.
4.3.3 Signal Reflection
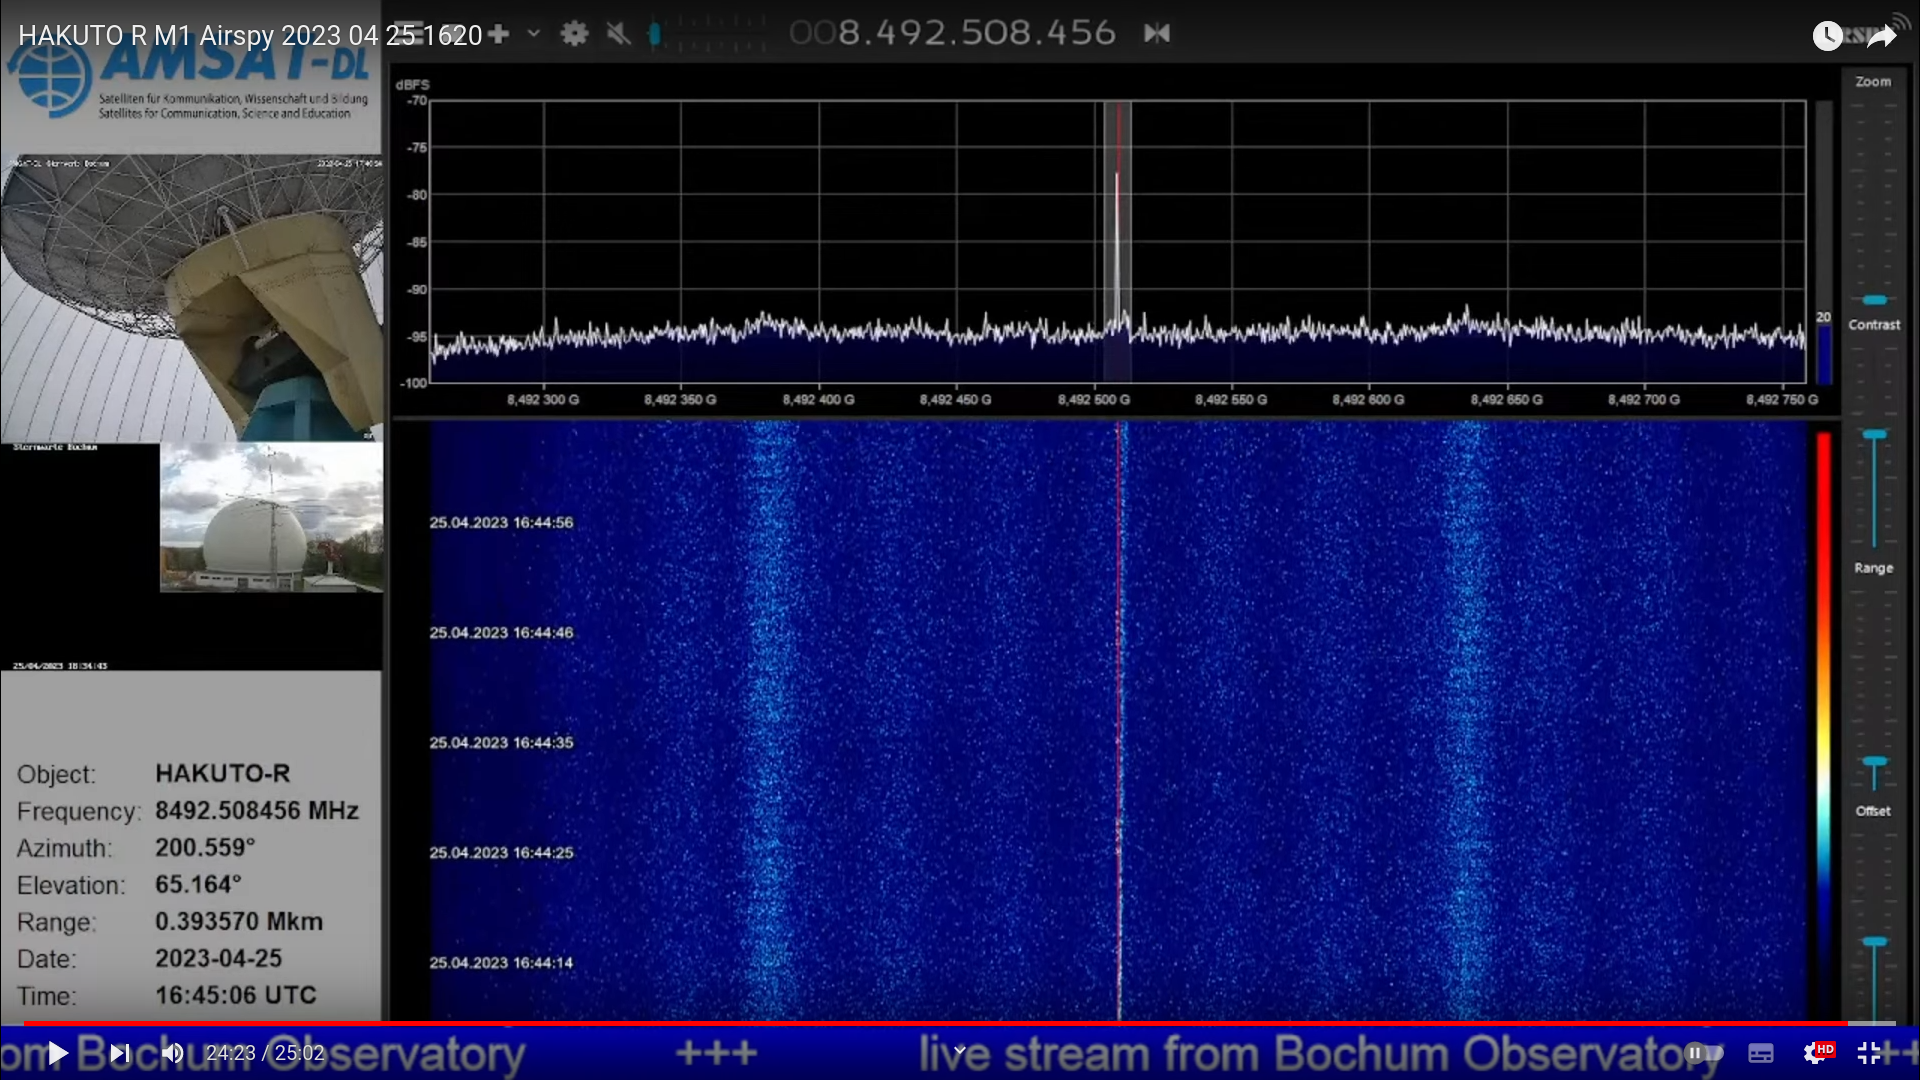
Fig05: AirSpy waterfall display showing signal reflection.
A diffuse signal becomes gradually visible just to the right of the residual carrier. From this observation an estimate of vertical velocity can be made.
The signal is 15-20 dB lower than the carrier and the separation increases over time. At LOS it occupies a bandwidth of some 5 kHz.
This phenomenon is compatible with reflection of the carrier off the Moon’s surface, as reflections would have a different Doppler shift compared to the direct line-of-sight signal.
The Moon’s surface is rough, so the reflected energy fluctuates rapidly as to frequency and amplitude, being the sum of an infinity of elementary reflections.
Because the energy is diffuse, there is no specific frequency to record for this phenomenon. Roughly the median is perhaps 3.7 kHz at LOS, equivalent to a velocity difference of 130.6 m/s as resolved along the line-of-sight to Earth.
Assuming the descent is vertical (i.e. has no horizontal component of velocity), that along line-of sight speed can be resolved to a vertical speed of 148 to 161 m/s. The spread is due to slight uncertainty in location on the Moon.
Now 88s of free fall alone would achieve a vertical velocity from g = 1.624 m/s2 of 143 m/s.
4.4 Section F
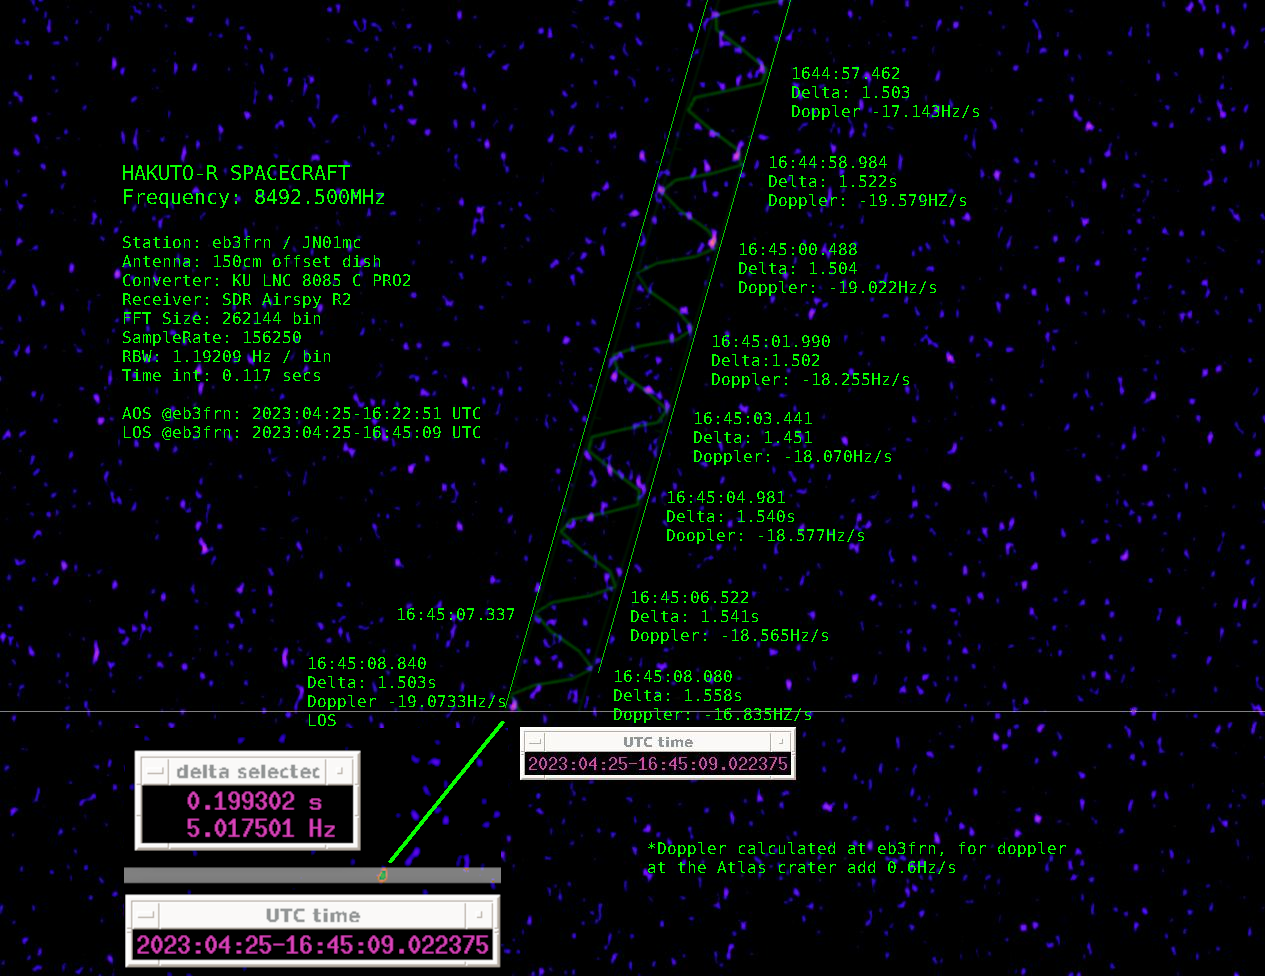
Fig06: Close-in plot of final 12s of freefall
The signal ceases abruptly at 16:45:09 utc when HAKUTO hits the Moon.
From stationary, an 88s freefall drop covers 6.3 km. 88s of the existing downward speed at E will add to that drop altitude.
A spectacular epitaph is recorded in fig06.png , the result of hours of painstaking research by EB3FRN.
5. Conclusion
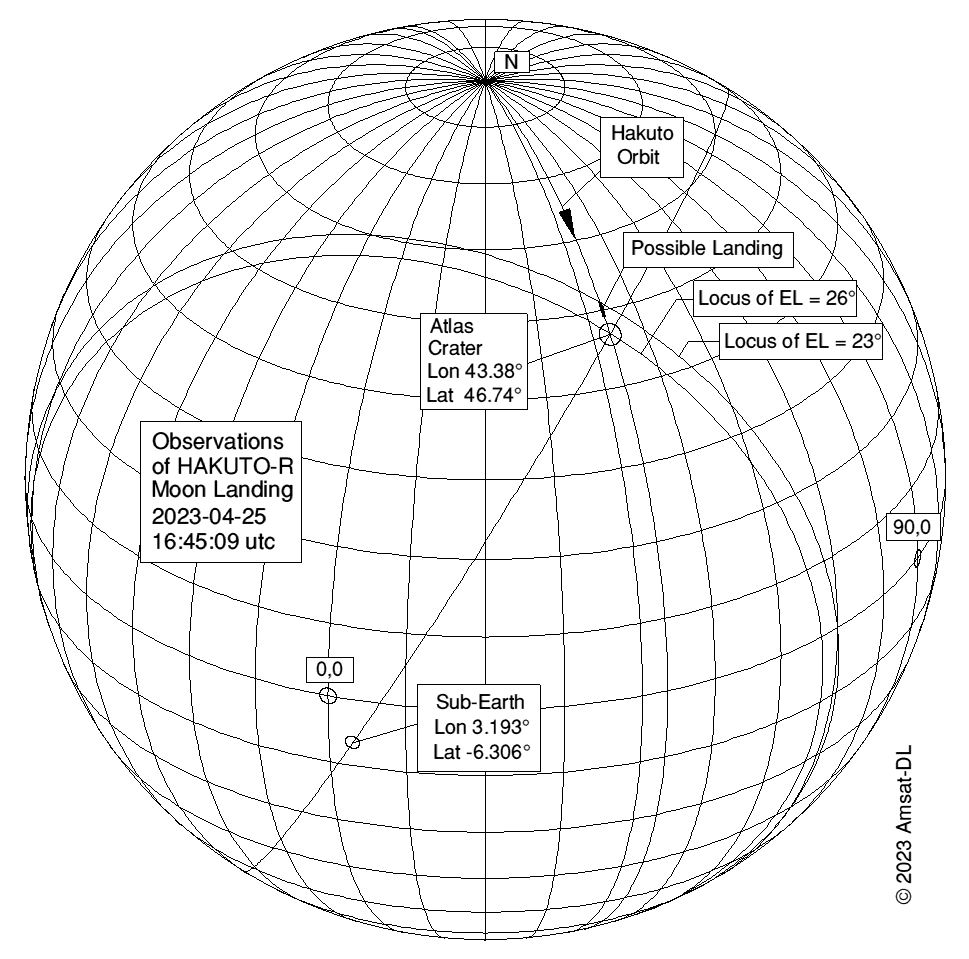
Fig07: Plot showing positional relationships at the Moon
The doppler shift profile shows that HAKUTO-R hit the Moon at 2023-04-25 16:45:09 utc.
De-resolving (a) the freefall acceleration and (b) processing the spin wobbulation characteristics suggest that the landing was a few degrees short of Atlas crater, latitude +50°, longitude +43°. See fig07.png .
To land from a 100km Moon orbit requires a delta-V from the engine of 1634 m/s. We would assume that mission management knew the remaining fuel was insufficient for a soft landing and prepared for it.
Published: 2023 May 15 (Issue 4)
Update 2023-05-23
HAKUTO-R M1 has been located by the LRO team: http://lroc.sese.asu.edu/posts/1302
Update 2023-05-26
ispace published their findings today: Results of the “HAKUTO-R” Mission 1 Lunar Landing:
“During the period of descent, an unexpected behavior occurred with the lander’s altitude measurement. While the lander estimated its own altitude to be zero, or on the lunar surface, it was later determined to be at an altitude of approximately 5 kms above the lunar surface. After reaching the scheduled landing time, the lander continued to descend at a low speed until the propulsion system ran out of fuel. At that time, the controlled descent of the lander ceased, and it is believed to have free-fallen to the Moon’s surface” – which is not to far away from our conclusion above!
Image sources: fig01,02,03,04,06 EB3FRN; fig05 EA4GPZ; fig07 G3RUH.